How I practiced investing with fake coins before real money

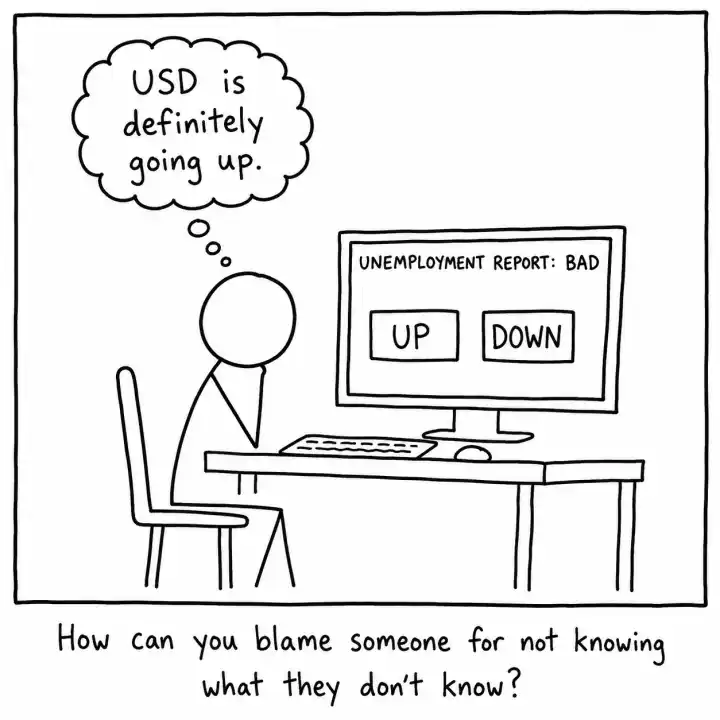
Can you imagine someone betting binary options on the USD to be strong right after a very bad unemployment report at the end of the year? Then jumps into cryptocurrency and tries to predict ETH BTC trends? That was me and at that point it didn’t feel like a shameful thing, but how can you blame someone for not knowing what they don’t know?
Some people have mentors – someone to guide them and recommend books. I didn’t even know things like this existed and I didn’t know where to look.
To me the entire investing process was a random guy sitting in front of 6 screens and looking at charts 24×7 somewhere on the 50th floor in New York City.
I absolutely believe it is normal to feel lost and dumb at the very beginning. Every expert was once a beginner. What is not normal is to keep delaying the learning – because that moment might never come on its own.
The idea to use financial knowledge and sit in front of a screen to make some money was very tempting. But investing always felt uncomfortably close to gambling to me – shady by association.
Practicing investing without risking real money
After a day or two researching I found that binary options is a good thing, at least it looked like that to me. Just think about it – low minimum bet value, refilling the balance with a debit card directly – sounds easy to do. I decided that binary options with trials were a very beginner-friendly tool.
So I proceeded with that because I didn’t have much money to pour into this endeavor, and mostly because I wasn’t sure if it was safe – so I figured I could just create an account and get unlimited free coins to test it before commiting.
Why I kept losing when I followed the chart
The first thing I did was watch YouTube videos of how other people did this: what currencies they picked, how long they set their bets. I saw many people were betting on the USD/CAD – the US dollar to Canadian dollar pair. So I did the same. It felt natural – it was the most popular trading pair on the platform. There was no real reasoning.
I had no idea how these charts actually worked, what was the difference between line, bar and candlestick charts. I knew some of them were green and went up, others were red and went down, and some looked like a spinning top. I believed that following the trend was enough.
As expected, I burned through free coins on those bets trying to do pure math and common sense (if everything was green – it would probably keep going up, if everything was red – it would probably go down, if it was something in the middle – I didn’t touch it) without external context.
After enough losses I started to question what I was doing wrong. Anyone experienced reading this can probably spot every red flag already.
What changed when I started with the news
That was when the real research started. Unexpectedly for me, after reading articles like “Why USD is going down today” and “Why CAD is strong” I realized I had been ignoring every external factor entirely. I figured out that trends were tied to real-world events – what people said, what governments decided, what companies reported.
Let’s say a bank is about to get a tax credit from the government for opening new branches – if the bank executed correctly, their revenue would go up. Investors would want a piece of that, and buying shares is how they get that piece, so more people buying means higher demand for the stock itself, which pushes the price up.
On the other hand, let’s say a company is about to release a promising product but early adoption shows a high return and refund ratio. This would cost the company significantly and leadership has no clear answer for it. In this case some nervous investors may start selling their shares, and more shares available for sale with fewer people buying means supply builds up and the price drops.
I started applying this and making more safe and strategic moves, waiting for a clear signal – a government statement, an economic report, anything pointed in an obvious direction. Looking back, you could call it a strategy, and it was actually working – I started seeing a small surplus of free tokens. A small, but a surplus.
I reduced my bets from every 5 minutes to once a day or so, waiting for a clear deep, one with enough evidence behind it to feel like a real decision backed by facts, not a guess.
Over time I reserve engineering the process entirely: instead of reacting to charts, I started with news and reports – looking for the most obvious reason a currency or stock would move. The goal was to find the safest entry possible to minimize the chances of losing. I wasn’t proficient yet, so I looked only for strong and obvious signals, e.g. a stronger than expected labor report, falling inflation, positive GDP growth. No guess.
One well-researched bet a week beats winning once and losing everything the next day.
I would come back the next day or a week later to evaluate what I lost or gained and what I didn’t understand at all. Some movements still made no sense to me – they didn’t fit any pattern I identified. Later I realized there are more forces at play here – but that’s a separate conversation.
It all came down to repetition – applying the same process across different market conditions. At that point I was confident I was getting better at this. The coin surplus was starting to show it. I still made bad bets, but less frequently than before. Every good decision was backed by facts.
What the fake coins taught me
One morning in February 2018 I was reading news about US labor growth: 4.1% unemployment, wages up 3% on average. These numbers meant nothing to me in isolation – I had no baseline for what good or bad actually looked like, so I looked at news and articles around it and what I found surprised me. Every financial publication was calling it unexpected – the fastest growth in years.
I pulled up the USD/CAD chart and started placing bets. Most landed well, the strong jobs data was doing exactly what I expected. I stopped a few hours later when the charts slowed down, I didn’t push it – the research had done its job.
Later I landed a better job and for the first time had real money to work with. But binary options still felt like a lottery – even with research behind it, you’re betting on a single moment in time. It was unpredictable. One piece of unexpected news could wipe a bet regardless of how solid your reasoning was.
What I gained from that process was worth more than any win, it changed everything. I turned a gambling platform into a classroom. It taught me how markets actually move and prepared me to use that knowledge with real money.
Books, news and articles – everything I had read finally had a place to land and seeing more green than red in my results for the first time felt satisfying. No more betting USD strong after a bad jobs report. No assumptions. No guesses. Just research.
For the entire time I used the platform I put in exactly $0. Those last trades with USD/CAD felt like a final exam. I had a strategy and I wanted to prove it worked. The whole phase – the errors, the free coins, the charts I barely understood – was always building toward something real.
I had learned that investing is 99% preparation and 1% execution. At the beginning those numbers were completely reversed.
Why I moved to a brokerage account and put in my first $50
To move forward I needed a tool that let me buy when I wanted, hold as long as I needed, and sell when I decided – not when a timer ran out. This time, knowing exactly what I was looking for, the research didn’t take that long. That tool was a brokerage account – a platform that let me buy and hold securities for as long as I wanted. Moving from free coins to real money still felt dangerous, even with a reputable broker. I wanted to make this transition smooth so I was looking for an account without extra hidden withdrawal or deposit fees, that had an easy to understand interface and quick sign up process.
My first real investment came after COVID-19, when most stocks had already rebounded. It was time to play the game with rules I actually understood. Having lost enough free coins to know better I decided I wanted a fundamental pick.
An industry with a large and growing customer base, one that could also benefit from government tax incentives. Another criterion was a relatively small market capitalization leaving more room to grow. I was planning to hold it for a long time (two years felt like long term to me at the time).
That was quite a shift after betting on currencies. But the logic was the same: research first, and only then investing.
I was convinced the energy sector would grow long term, the question was which segment – renewable, gas, oil, or nuclear. Of course gas and oil at that point looked very attractive, given that most industries still ran on gas and oil and demand wasn’t going anywhere.
My metallurgy background pointed me toward the picks and shovels – unglamorous middle layer that everything else depends on – the middle layer that everything else depends on and with growing demand, that layer would grow too. I landed on Antero Midstream – a company operating pipelines, compression stations and water handling, the essential link between extraction and processing.
The research was not perfect either, I still hadn’t read the 10-K report (a company’s annual financial filing) or analyzed cash flow projections. I had researched the industry outlook, potential tax benefits, and long-term demands for gas and oil. In my mind I had done solid research and I was confident enough to put in my first $50.
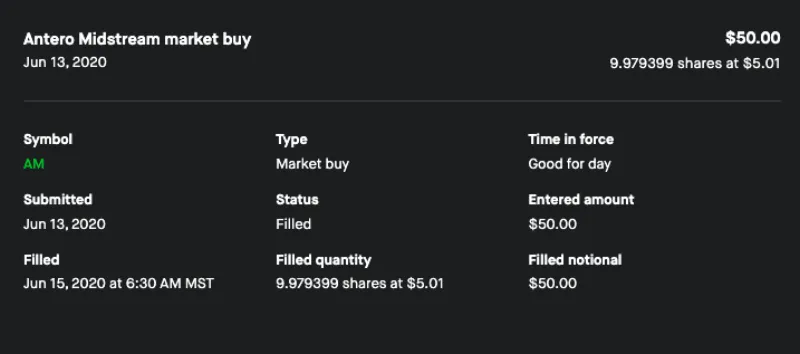
Months later, seeing 10% up in my portfolio I knew the method worked with real money and I could scale it
I had to refresh the mobile app twice as I wasn’t sure the numbers were correct. It felt nothing like hitting a binary options bet. It felt like I applied some effort in the right direction, it proved that research and patience actually worked.The strategy was working in action.
The biggest difference from binary options was simple – I could hold as long as I wanted. No forced sell at the wrong moment. Just patience. Bad days, bad quarters, even a bad year – none of it mattered if everything worked.
After binary options where nothing lasted more than a day, two months felt like forever. That was just the beginning of understanding what long term investing and compound interest actually meant in practice.
A bad unemployment report was no longer an enemy, it no longer worked against me – it became a signal, a chance to invest at a better price.
The question that made me build a calculator
The only question I had – if I keep doing this, reinvesting, same returns, what does this look like in 10 years? What if I invested more each month?
I used paper to do basic interest math but it wasn’t a quick way to calculate what $50 a month compounded over 10 years might look like. So I moved to Excel, which felt too rigid and at $120 a year, that was two months of investing money I wasn’t willing to spend. Then I looked online but most calculators didn’t let me compare scenarios side by side. So I built one that does.
Feeling ashamed about not knowing this earlier is not a problem. It means you understand you can do better. It’s the opposite of ignorance. Now it’s time to figure it out.
See what your money could grow into
Enter your numbers and we’ll show you what consistent investing can do over time.
One article a week. Real numbers, real mistakes, no finance bro nonsense. If you made it this far, you already know if it’s for you.

6 Comments
Comments are closed.